In this post, I will talk about my discovery after the sentiment analysis of NBA players tweets.The code to achieve this can be found on my github: https://github.com/ChaoranWei/NBA-player-tweets-analysis. I will talk about my basic methodology to achieve this, and then something interesting I discovered during the analysis.
1. Basic Methodology
The logic behind this analytic project is simple: get the data, then analyze it. To get the data, we need to use Twitter API. I personally use tweepy package in python to achieve this. Note you also need to register in Twitter to get the necessary keys. After you get the the tweets of NBA players, you can analyze whatever you want and have fun!
2. NBA players sentiment analysis
I use AFINN.txt as the dataset to analyze the sentiment. This dataset has a lot of positive and negative words ranging from -5 to 5. -5 means the given word is extremely negative, which mostly consists of inappropriate words. 5 means the word is extremely positive, such as breathtaking and harrah. The limitation of this dataset is that we can only measure the degree to which a given word is positive or negative, but we cannot get the specific emotion, like excited, painful, etc.
The evaluation metric for the sentiment is the following: We calculate the aggregate sentiment level of a certain player and divided by the number of words in his tweets, we get average sentiment level per word. This turns out to be a very low value, without any surprise. However, if we multiply this value with 100, we get the sentiment level per 100 words, which is better for visualization.
For example, if in Andre Iguodala’s tweets, We add sentiment level of all words and then divided by number of words in his tweets, we get 0.19. This value denotes the expected value of the sentiment level per word. We multiply 0.19 with 100 we get 19, which becomes the expected value of the sentiment level per 100 words, which I consider more illustrative.
After analyzing the tweets of NBA players, here are the interesting results:
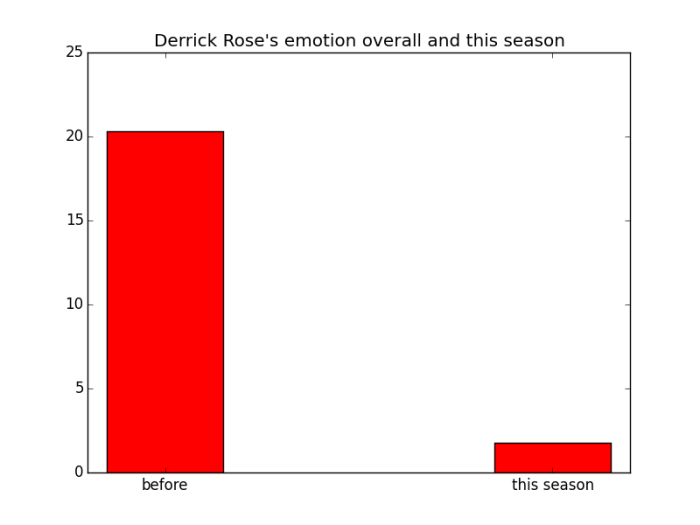
For example, we all know the youngest MVP player in the NBA Derrick Rose suffers from a really bad injury several seasons ago. He is still pretty young and promising but due to his injury and psychological side-effect, he did not play very well this season. Now let’s visualize his sentiment and see if the bad game affects his emotion, or vice versa.

Note that from this we cannot draw the conclusion that bad game affects the emotion of our D Rose, nor could we conclude that the emotion effect the performance this season. To discover more about this issue, we need to resort to time-series analysis techniques, such as Impulse-response function or co-integration test. This post discuss no further of this.
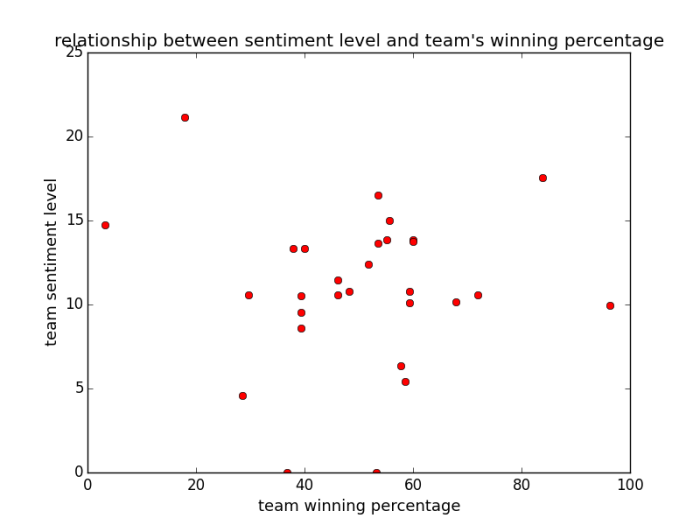
Another interesting result is the correlation between the sentiment level and the winning percentage of the team in 2015-2016 season. It is intuitive that if a team plays really bad this season, sentiment of all its players cannot be very high. If a team (like Golden State) plays very well, sentiment level of players in this team will be high. Let’s discover whether this claim is true:

In this graph, each data point denotes a team. We expect the scatter plot to roughly have positive slop, but the graph indicates otherwise. There are two potential reasons for this:
- data value for each team is limited. This makes sense, because not all NBA players are big fan of Twitter. Thus for some teams, tweets of only one or two players are collected. This deficiency of data points will result in high variance and maybe more outliers.
- There are really no correlations between the two for some reason.
To further develop this argument, we want to eliminate some outliers (thus high variance) and see the result again. Note that from eyeballing the graph we can find that there are 6 apparent outliers but only 29 data points, therefore 20% of all data values might be eliminated due to outlier detection. 20% is too much for the percentage of outliers, but we do it anyway, because the variance in this dataset really is too big.
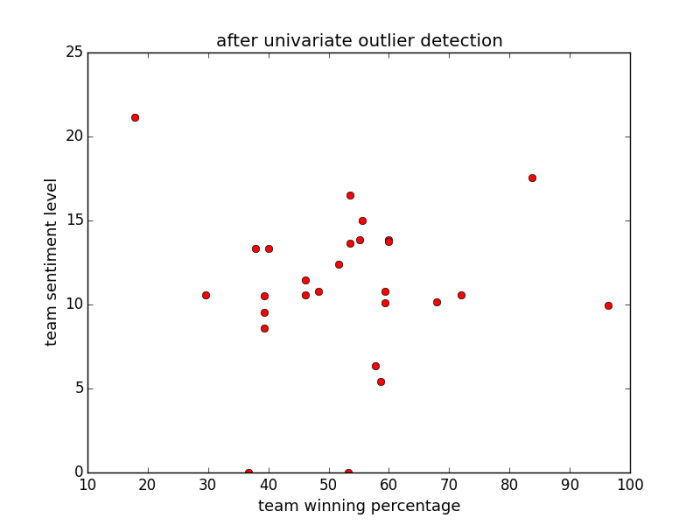
There are two popular methods for outlier detection that python sklearn package supports: Univariate method and EllipticEnvelope method. We will try both algorithms for outlier detection.
Univariate:

This seems not effective. There is a good reason for that: We only consider sentiment level (because this is univariate) when detecting the outlier, which does not capture the interaction between two variables. We may not consider this method.
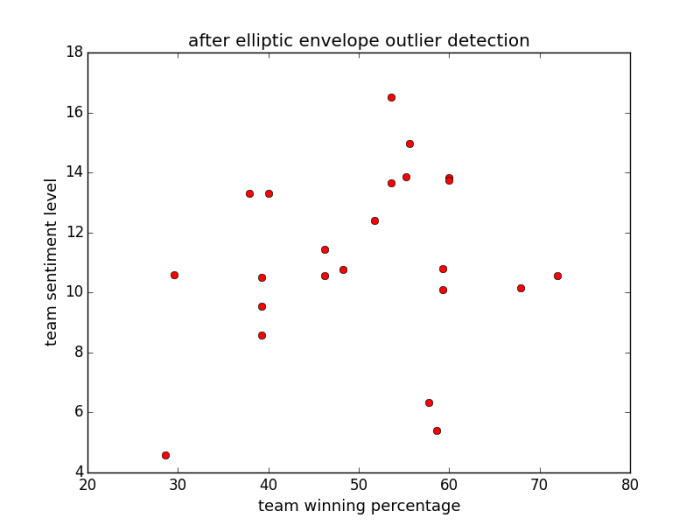
Elliptic Envelope:

This method removes some apparent outliers. This result is satisfactory, because we cannot expect sentiment level to be a strong indicate of winning percentage of a certain team. After calculating the correlation between the two variables, we get 0.45 correlation between two variables, which is low to moderate correlation between two variables.
We take another perspective to analyze this dataset. If we consider team winning percentage as dependent variable and team sentiment level as independent variable. It is then a good idea to calculate Coefficient_of_determination (R^2). By definition, Coefficient of determination is the percentage of variable variation explained by the linear model. In this context, R^2 is the percentage of variation of winning percentage explained by sentiment level. After some calculation by sklearn library, we get R^2 = 0.2. Again, intuitively sentiment level is a weak but potential indicator of team winning percentage, so R^2 = 0.2 means sentiment level has some explaining power to the winning percentage.
In conclusion, both graphical and analytical evidence suggest that there are correlation between the winning percentage of team and the sentiment level of the player in this team, even though we cannot conclude anything about which affects which. This is not only one of many interesting basketball analytical result, but also have some application in the field of basketball analytics. For example, if we want to run some regression analysis against winning percentage of a NBA team, we can use sentiment level as a feature in the analysis.
3. Code
The complete code has been uploaded on my github account. Please refer to: https://github.com/ChaoranWei/NBA-player-tweets-analysis.